



A chart of accounts is the organised list of every account your business uses to record money in and money out, sorted under five categories: assets, liabilities, equity, revenue and expenses.
In Australia, this list, sometimes called a standard chart of accounts, works the same way whether you’re a sole trader or a growing company: you list your income and cost types, assign each a number and set the list up inside your accounting software.
A well-built chart of accounts makes your financial reports easy to read. A poorly built one leaves you guessing every time you open a report.
This guide covers the five account types, a step-by-step process for building your own, how Xero, MYOB and QuickBooks Online each handle setup, exactly how to export and import a chart of accounts between platforms and when it’s time to restructure one that’s outgrown your business.
Key takeaways
- A chart of accounts sorts every transaction into one of five categories: assets, liabilities, equity, revenue and expenses.
- Building one follows a clear sequence: list your accounts, choose a numbering system, then set it up in your software.
- Xero, MYOB and QuickBooks Online each ship with a default chart of accounts you can customise or replace.
- Exporting and importing a chart of accounts as a CSV or Excel file saves hours when switching platforms.
- Most small businesses need between 30 and 50 active accounts, not hundreds.
What is a Chart of Accounts in Accounting?
A chart of accounts or COA is the structured index behind every financial report your business produces. Each account gets a name and a number and every transaction records against one of these accounts, feeding directly into your profit and loss statement and balance sheet.
A chart of accounts is used for turning raw transactions into a report you can actually read. A cafe owner checking this index sees food sales recorded on their own line, separate from beverage sales, catering and delivery. That separation only works if every account has been sorted into the right type to begin with
The Five Account Types
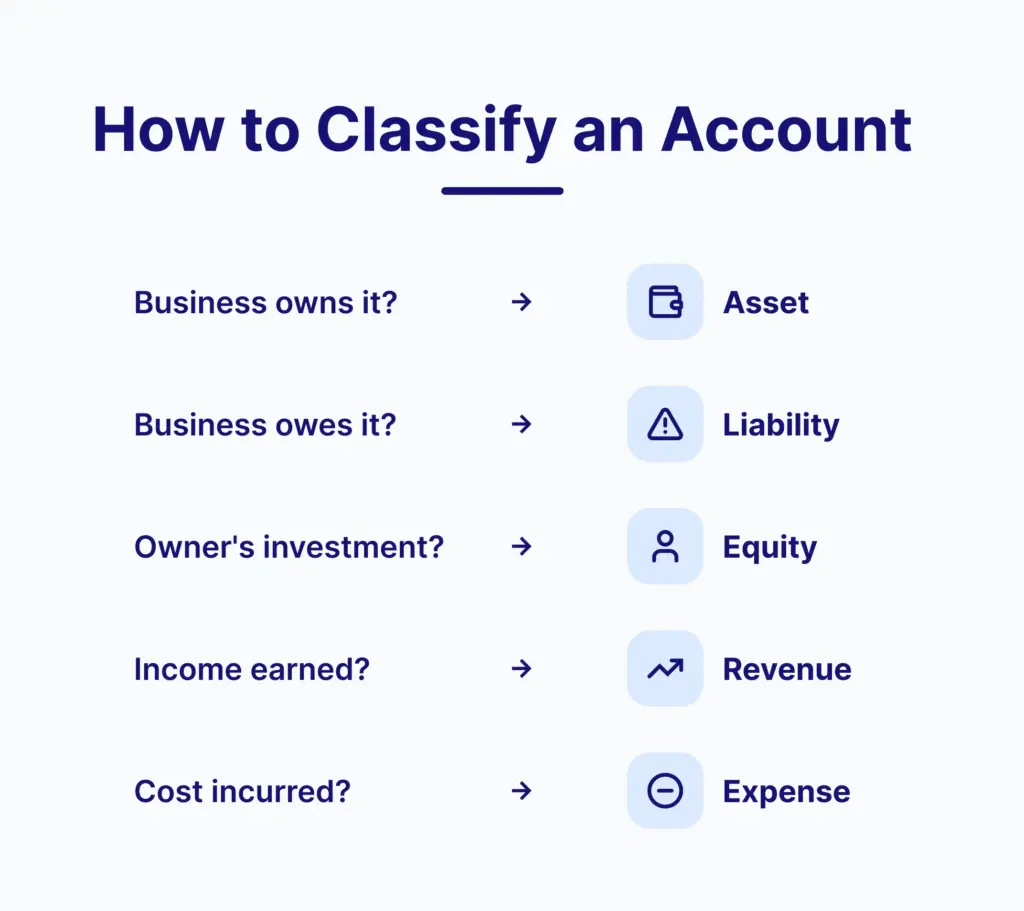
Every account in your chart of accounts belongs to one of five types. Assets, liabilities and equity appear on your balance sheet. Revenue and expenses appear on your profit and loss statement.
- Assets are what your business owns: your bank balance, money owed to you by customers and equipment.
- Liabilities are what your business owes: supplier payments, credit card balances and loans.
- Equity is the owner’s stake in the business after liabilities are subtracted from assets, including original investment and profit kept in the business over time.
- Revenue is the income your business earns from selling products or services.
- Expenses are the costs of running your business: rent, wages, software subscriptions and marketing.
Understanding the five account types is easy. The bigger challenge is building a chart of accounts that tracks what matters without creating unnecessary complexity.
How to create a Chart of Accounts: Step by step process
Building a chart of accounts and setting one up properly, is a seven-step process that starts on paper, not inside software.
Step 1: List every income and cost type in your business
Write down every way your business earns money and every category it spends money on. A café lists food sales, beverage sales and catering separately. A consulting firm lists project fees, retainer income and training income separately.
Step 2: Group the list under the five account types
Sort what you listed in Step 1 into assets, liabilities, equity, revenue and expenses. At this stage, don’t worry about numbers or software; just confirm every item has a home.
Step 3: Choose a numbering system
A numbering system, also called an account code or one of your accounting codes (some older systems still use the term “line of accounting” for the same idea), assigns a unique number to every account so it’s easy to find and sort. A common structure for Australian small businesses uses:
- 100 to 199 for assets
- 200 to 299 for liabilities
- 300 to 399 for equity
- 400 to 499 for revenue
- 500 to 599 for expenses
Leave gaps between numbers (100, 110, 120) rather than sequential ones (100, 101, 102). A landscaping business that starts with 100 for its bank account and 101 for receivables has nowhere to insert a new asset account later without renumbering everything above it.
Step 4: Assign codes to each account
Work through your Step 2 list and give each account a number within its range. Keep names short and specific, “Software Subscriptions” is clearer than “Miscellaneous,” and a name that’s clear on paper stays clear once it’s buried in a long chart of accounts list inside your software.
Step 5: Build the list in your accounting software
This is where the plan on paper becomes a working chart of accounts. What this looks like depends entirely on which platform you’re using.
Step 6: Test with a few sample transactions
Before relying on the new structure, record a handful of real transactions, such as a sale and a supplier payment and confirm they land in the right accounts.
Step 7: Review once a year
Revisit your chart of accounts at the start of each financial year. Archive accounts with no activity and add new ones for revenue streams or costs that didn’t exist when you first built the list. Step 5 carries the most variation between platforms, since setting up a chart of accounts in Xero, MYOB or QuickBooks Online each starts you off with a different default and a different path to editing it.
Setting Up a Chart of Accounts in Xero, MYOB and QuickBooks Online
Xero, MYOB and QuickBooks Online each generate a default chart of accounts the moment you set up your file, so the work is editing that default rather than building a list from nothing.
- Xero: The Xero chart of accounts is created automatically on setup. Customise via Accounting > Chart of Accounts to rename, archive or add accounts. Industry starter templates (retail, hospitality, construction) are available through the App Store, useful for a trades business that would otherwise be editing a generic services template line by line.
- MYOB: The MYOB chart of accounts starts from an industry template offered during setup, pre-building categories closer to your business type than a blank default. Rename, add or mark accounts inactive from the accounts list (labelled “categories” in the newer interface).
- QuickBooks Online: Sets its default list based on the business type you select (sole trader, company, non-profit). Edit under Settings > Chart of Accounts and import a ready-made list directly during setup if you already have one built in a spreadsheet or chart of accounts template.
A business that wants the least editing gets closest to a usable list in QuickBooks Online from the outset. One that runs trades or hospitality saves the most time with Xero’s industry templates. One already working with a bookkeeper on MYOB keeps its existing structure intact through MYOB’s category import.
That last point matters beyond just choosing software: the same import and export tools that preserve your structure on one platform are what let you move it to another entirely.
Also Check: Xero Bookkeeping Services in Australia
How to Export and Import a Chart of Accounts?
Exporting and importing a chart of accounts lets you rebuild the list once and reuse it, rather than recreating every account from scratch each time you switch platforms, standardise across multiple business files or want to edit the list in a spreadsheet first.
Xero
- Export: Accounting > Advanced > Chart of Accounts > Export (downloads as a CSV file)
- Import: same screen > Import > choose your CSV file. Xero shows a summary of new, updated and archived accounts before you confirm, since it matches by account code.
MYOB
- Export: settings icon > Import and export data > Export tab > choose Categories > download
- Import: same screen > Import tab > choose Chart of Accounts > download MYOB’s template, fill it in, save as CSV or TXT, then upload. There’s no undo once an import runs, so check the file first.
QuickBooks Online
- To export a chart of accounts in QuickBooks Online: go to Reports > search Account List report > Export > Export to Excel
- To import a chart of accounts in QuickBooks Online: click Settings (gear) icon > Import Data > Chart of Accounts > browse for your file > map columns to the correct fields > confirm
A CSV file full of account codes only means something once it’s mapped against real numbers. Here’s what that looks like for three different business types, using a standard chart of accounts for small business as the starting template.
Chart of Accounts Examples for a Small Business
Here is a simplified example for a small Australian service business.
| Type | Code | Account |
|---|---|---|
| Asset | 100 | Business Bank Account |
| Asset | 110 | Accounts Receivable |
| Liability | 200 | Accounts Payable |
| Liability | 210 | Credit Card |
| Equity | 300 | Owner’s Equity |
| Revenue | 400 | Service Revenue |
| Revenue | 410 | Product Revenue |
| Expense | 500 | Rent |
| Expense | 510 | Software Subscriptions |
| Expense | 520 | Marketing |
A retail business needs inventory accounts and revenue split by sales channel, which the service example above has no reason to include:
| Type | Code | Account |
|---|---|---|
| Asset | 120 | Inventory |
| Revenue | 400 | In-Store Sales |
| Revenue | 410 | Online Sales |
| Expense | 500 | Cost of Goods Sold |
| Expense | 510 | Freight and Shipping |
A trades or construction business needs something else again: direct job costs split from general running costs, so gross margin per job stays visible rather than buried inside one expense total.
| Type | Code | Account |
|---|---|---|
| Expense | 500 | Direct Labour |
| Expense | 505 | Materials |
| Expense | 510 | Subcontractor Cost |
| Expense | 550 | Vehicle Running Cost |
When to Restructure your Chart of Accounts?
A chart of accounts needs a rebuild, not just a review, when any of these show up:
- You’re creating a new account almost every month because nothing existing fits
- Reports take longer to read because similar costs are recorded under different names
- You’ve added a new revenue stream, location or service line the current structure can’t separate
Two or more of these showing up at once is the signal to restructure rather than patch. Most restructuring gets triggered by problems that were preventable in the first place.
Common mistakes to avoid when setting up your Chart of Accounts
- Too many accounts: A chart of accounts with hundreds of categories creates confusion. Most small businesses need 30 to 50 active accounts.
- Inconsistent naming: “Office costs,” “office expenses” and “office supplies” often capture the same thing. Pick one name and stick with it.
- No regular review: Accounts pile up over time. Review your list once a year and archive anything with no recent activity.
- Deleting instead of archiving: Archiving preserves historical data. Deleting an account can break past reports.
Conclusion
A chart of accounts is the foundation every other financial report is built on. Get the five types right, number them with room to grow and review the list once a year and it keeps working as the business grows around it.
Whether that’s inside Xero, MYOB or QuickBooks Online, the same principle holds across any chart of accounts in Australia: enough detail to see where the money goes, without so many accounts that nobody can find the right one.
To find out how Outbooks can support your bookkeeping, call us on 0451 320 102 or email info@outbooks.com.au.
Frequently Asked Questions

Parul is a content specialist with expertise in accounting industry. Her writing covers a wide range of domains such as, Accounts Payable, Accounts Receivables, Bookkeeping and more. She writes well-researched content and has a strong understanding of accounting terms and industry-specific terminologies. As a subject matter expert, she simplifies complex concepts into clear, practical insights, helping businesses with accurate tips and solutions to make informed decisions.